
Published Friday, September 28, 2018 at: 7:00 AM EDT


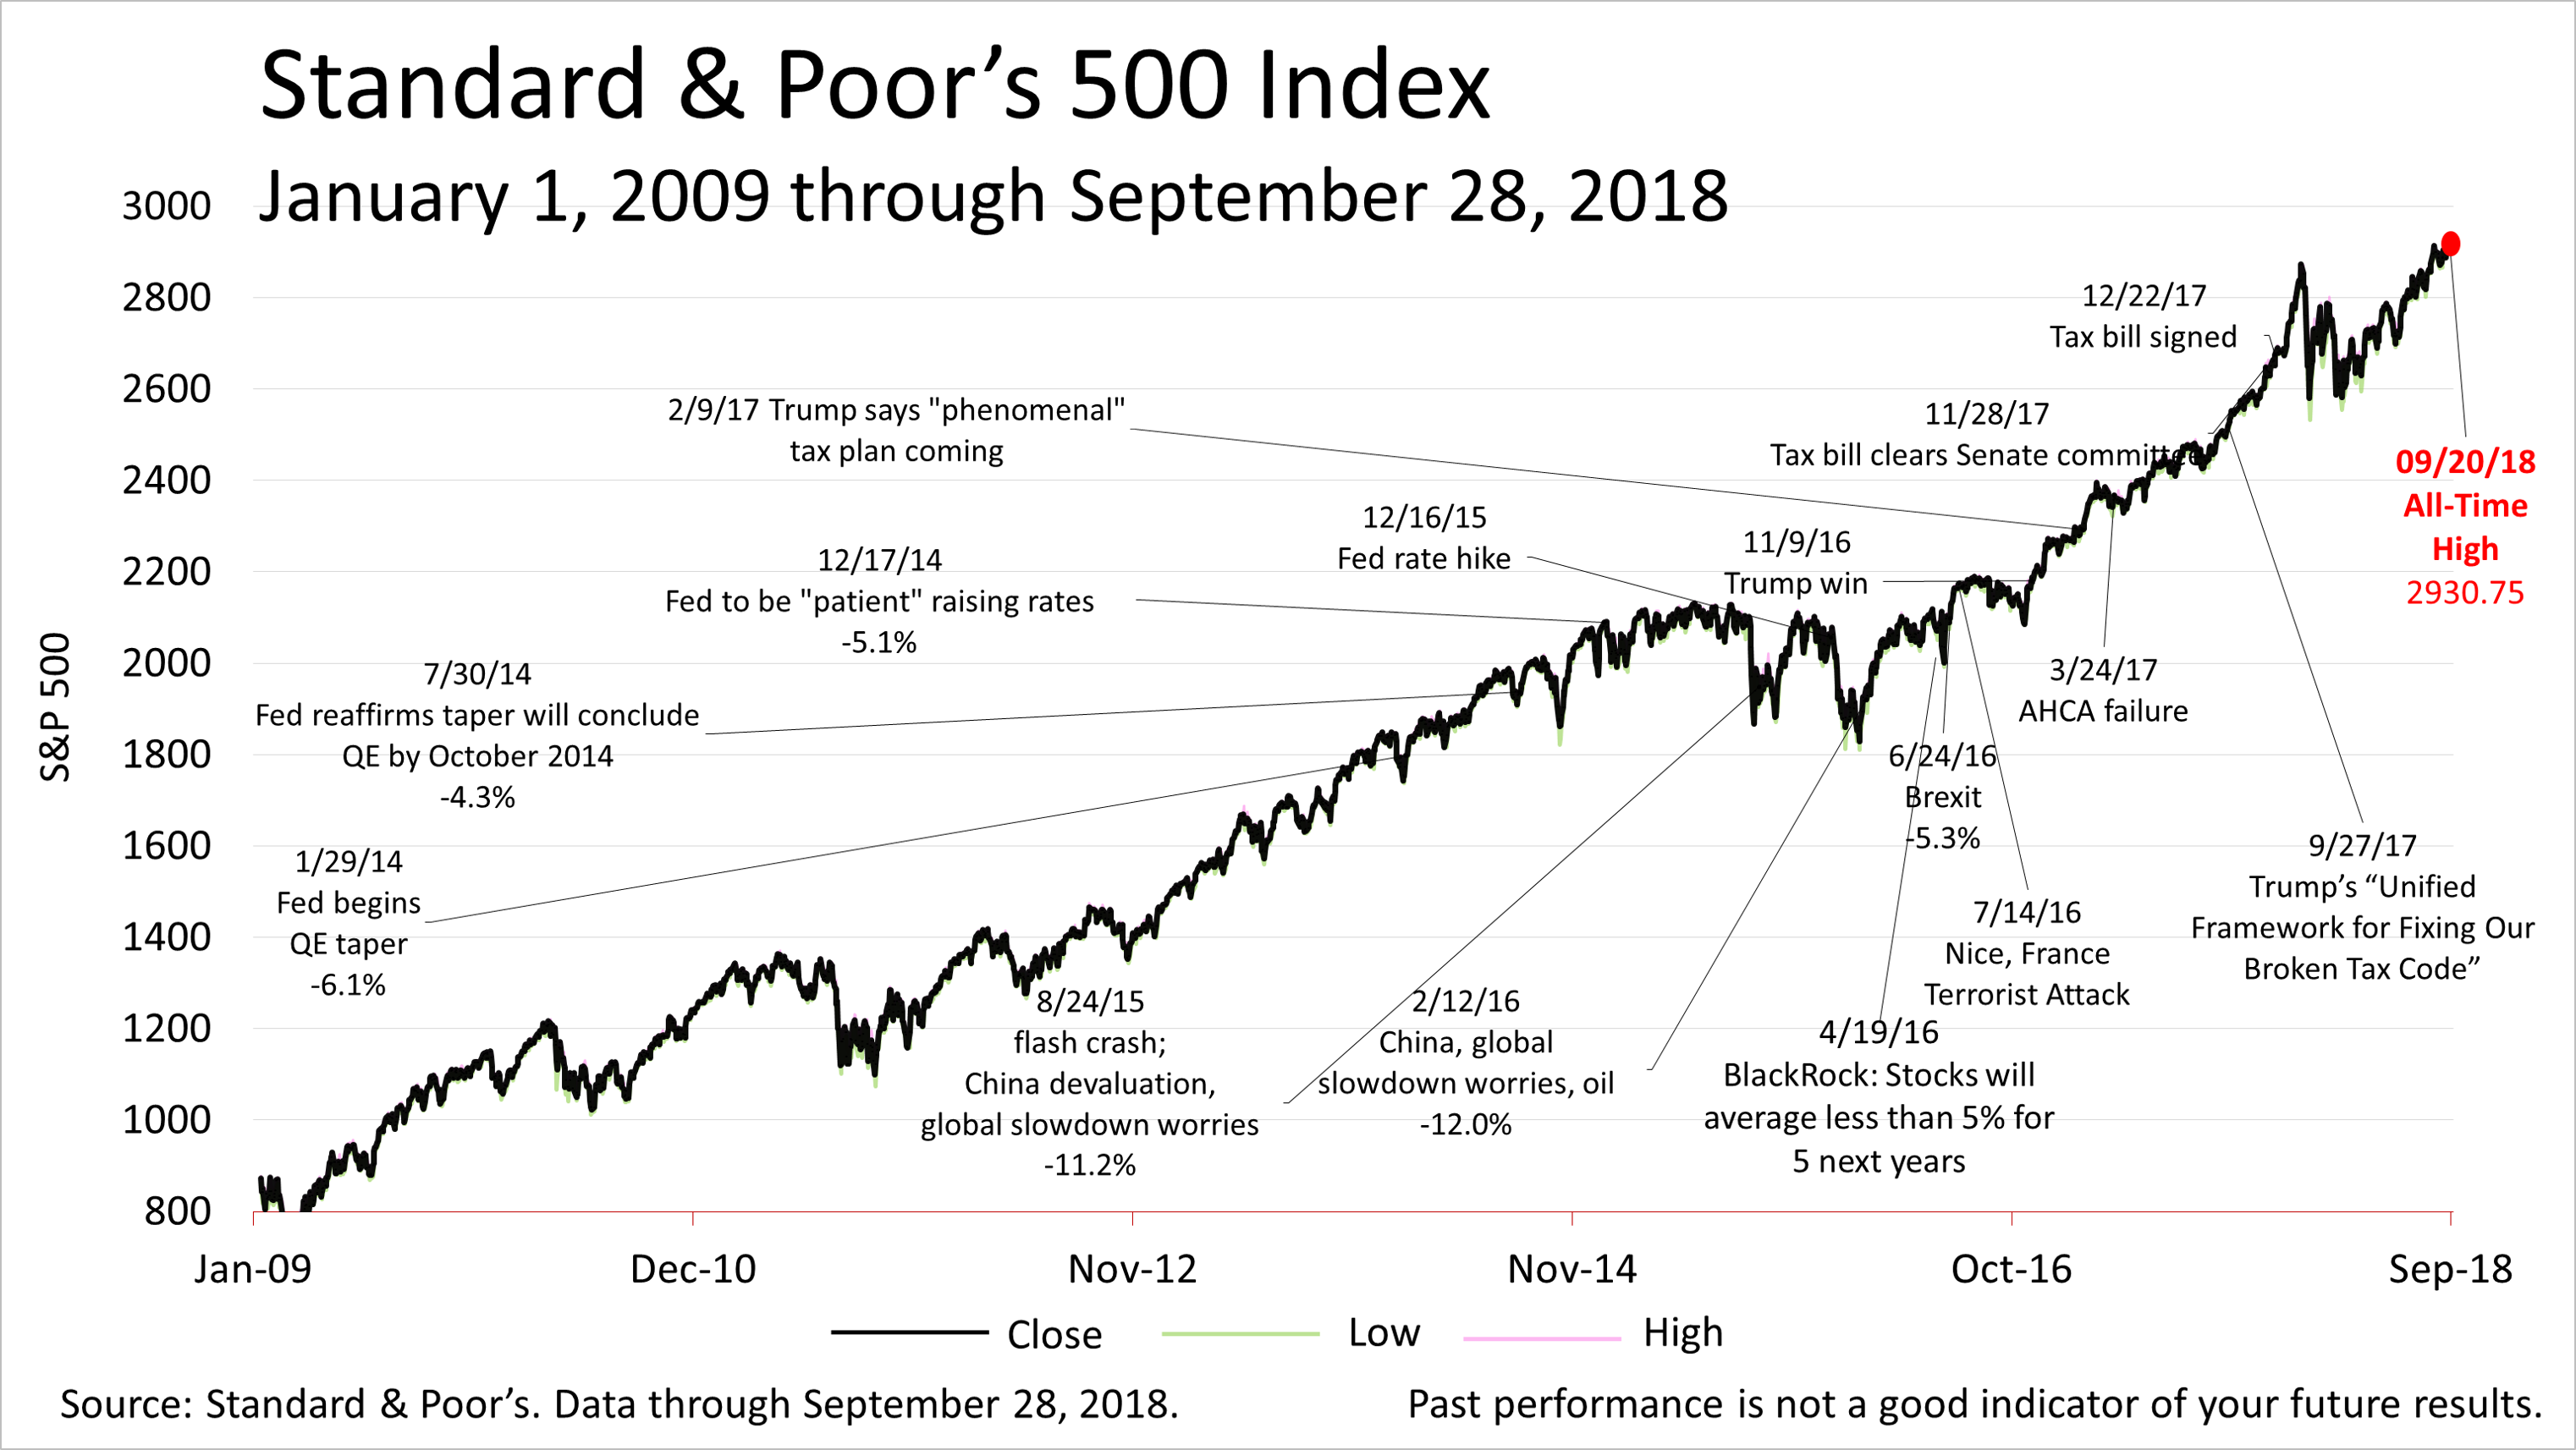
As the third quarter of 2018 closed, the Standard Poor's 500 stock index — a barometer of the U.S. economy — closed the quarter at 2913.98 on Friday, as the unusually strong and long economic expansion powered stock prices to within 1% of its recently reached record high.
The S&P 500 rose 7.2% last quarter. It was the best quarter since the end of 2013, and the index was up about 9% since the start of the year.
Amid abnormal political polarization in the U.S., a crisis of trust in internet security, and nationalism rising worldwide while globalism was under attack, the bull market and economic boom recently turned nine years-old — the longest in U.S. history — raising worries about risk. What's driving stocks?
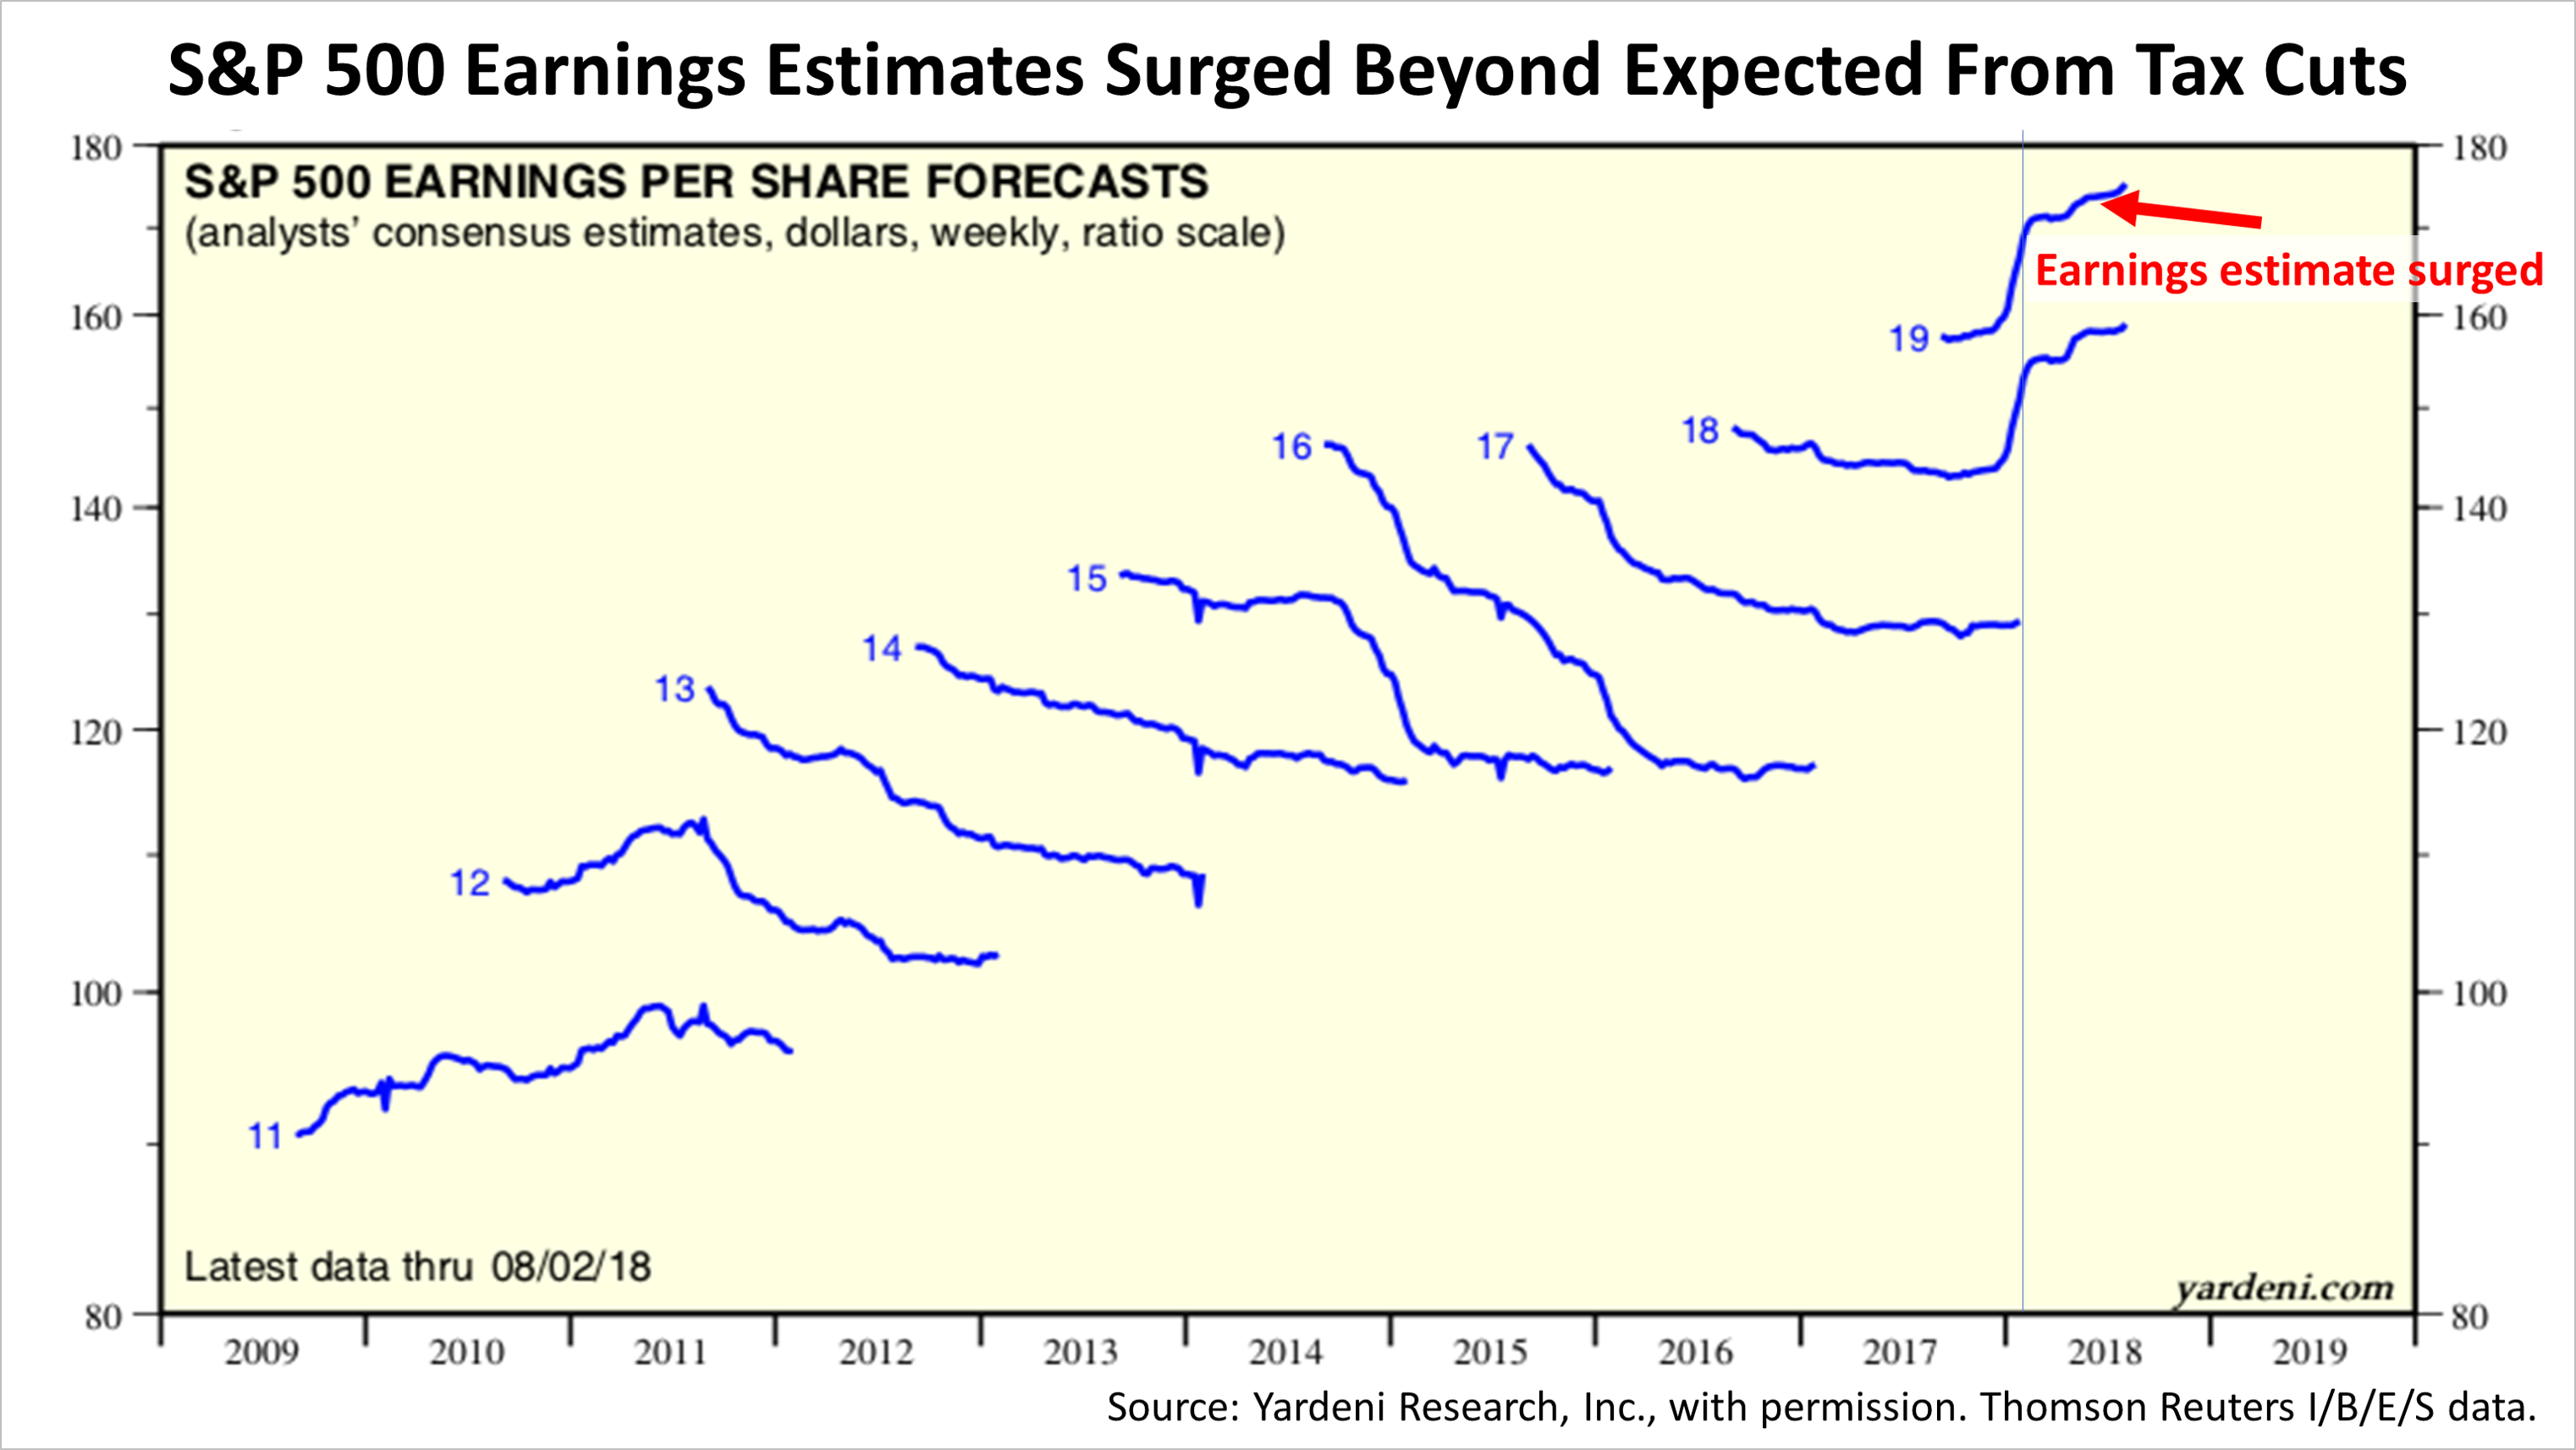
Earnings are driving stocks! This chart shows that the S&P 500 index experienced an unusual surge in profit expectations in the first eight months of 2018.
Earnings estimates by Wall Street analysts for the S&P 500 for each calendar fiscal year since 2011 started overly optimistic and then were shaved as the end of the years approached. That's the typical pattern. From 2012 through 2017, six consecutive years, earnings expectations were lowered substantially compared to when the year started.
However, the pattern for 2018 and 2019 is different. Since the signing of the Tax Cuts and Jobs Act on December 22, 2017, analysts have not lowered their expectations for 2018 and 2019 profits for America's largest 500 publicly held companies. To the contrary, earnings estimates surged!
Moreover, the initial earnings boost in January, February and March was expected, as analysts factored in the tax savings into their forecasts. However, the higher earnings forecasts continued beyond the one-time upward revision from the tax law, accelerating in April and through August 2018. This was an unexpected surprise.

Sales revenue estimates are generally subject to the same pattern as profit estimates. Revenue predictions by Wall Street's analysts normally are shaved as the end of each year closes in. In 2018 and 2019, estimates of sales expected at the S&P 500 accelerated, breaking their normal trend.
Accelerating sales estimates are not driven by taxes or corporate accounting. Sales are driven by consumers. So, the recent acceleration in expected revenue is a sign of unexpected consumer strength — a key fundamental to U.S. growth.
This article was written by a veteran financial journalist. While the sources are believed to be reliable, the information is not intended to be used as financial advice without consulting a professional about your personal situation.
This article was written by a professional financial journalist for Kevin Kennedy, LLC and is not intended as legal or investment advice.
© 2024 Advisor Products Inc. All Rights Reserved.
CONTACT
Phone: 510-748-1898
Fax: 510-748-1896
kevin@KevinKennedyLLC.com
1516 Oak Street, Suite 101
Alameda, CA 94501
This website uses cookies for navigation, content delivery and other functions. By using our website you agree that we can place cookies on your device. I understand
